Case study
Making SpeedBoost's own site fast, and proving it
A self-initiated project: build a performance agency's website, add common real-world problems on purpose, record the damage with Lighthouse, then remove each problem and test again under the same conditions.
Self-initiated demonstration project. This was not paid client work. The site tested is this one, and the problems were added deliberately.
Overview
The project in brief
- Goal
- Show a complete, honest performance workflow from baseline to verified result.
- Subject
- This website: a Next.js 16 marketing site with six pages.
- Method
- Repeated Lighthouse runs on a production build, before and after each fix.
Initial problems and changes
Four problems, each with a specific fix
| Problem added | Metrics affected | How it was fixed |
|---|---|---|
| Oversized hero imageA large uncompressed PNG served through a plain img tag, with no width or height. | LCP, CLS, page weight | Removed the decorative image, leaving a text heading as the main content and CSS for the visuals. |
| Render-blocking web fontsSeveral font weights loaded from a third-party stylesheet in the document head. | FCP, LCP, CLS | Returned to next/font, which self-hosts the files and reduces layout shift when fonts swap. |
| Heavy client librariesChart.js, Moment.js and the full Lodash build were bundled for a single dashboard panel. | TBT, JavaScript weight | Removed the client-side chart and all three libraries. The dashboard visuals on this site are server-rendered SVG and CSS. |
| Expensive work during hydrationA client wrapper sorted a large generated dataset on load, then inserted a banner above the content. | TBT, CLS | Removed the unnecessary client work and the late-inserted banner, returning the page to Server Components. |
Technical challenges
What made this harder than it looks
A clean build leaves little to fix
A careful Next.js site can score well from the start, which makes for a weak demonstration. Problems were added on purpose, and that choice is disclosed wherever results appear.
Keeping the comparison fair
Lab scores vary between runs. Each result is the median of five runs of a production build, on the same machine, with the same Lighthouse version and settings.
Reporting what a lab test can't show
Lighthouse page-load runs cannot measure Interaction to Next Paint. INP stays marked as not measured, with Total Blocking Time shown as the lab stand-in.
Tools
Tools used
- Lighthouse CLI
- Chrome
- Next.js 16 with Cache Components
- React Server Components
- next/font and next/image
- Tailwind CSS 4
- TypeScript
Results
Home page, mobile test
Performance
Accessibility
Best Practices
SEO
Largest Contentful Paint
LCP
When the largest visible element finishes rendering.
Cumulative Layout Shift
CLS
How much visible content moves unexpectedly while loading.
Total Blocking Time
TBT
How long long tasks block the main thread. The lab stand-in for responsiveness.
Lessons and outcomes
What the measurements showed
The best-looking number wasn't the best page
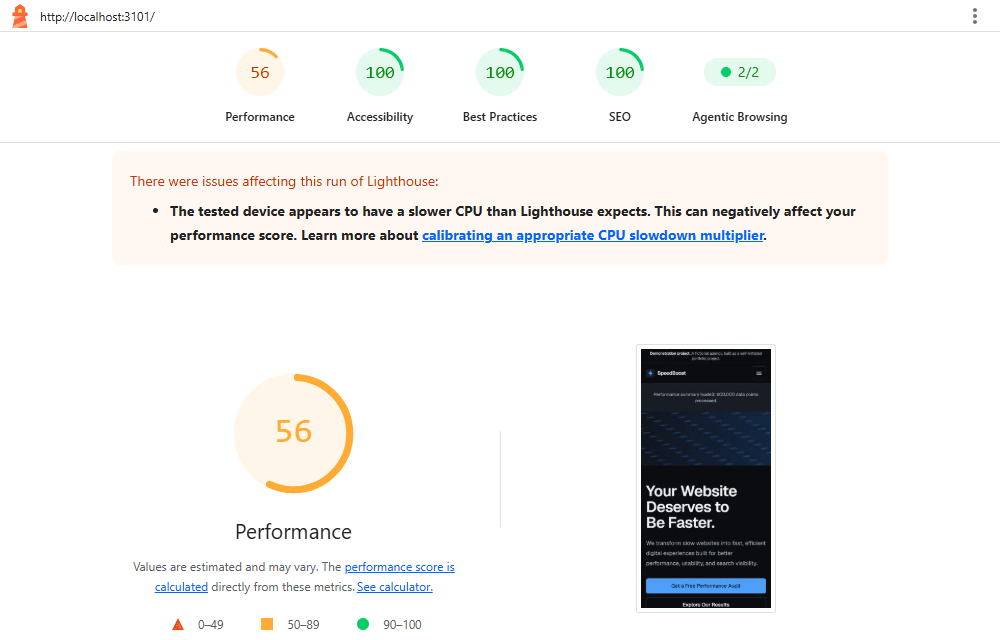
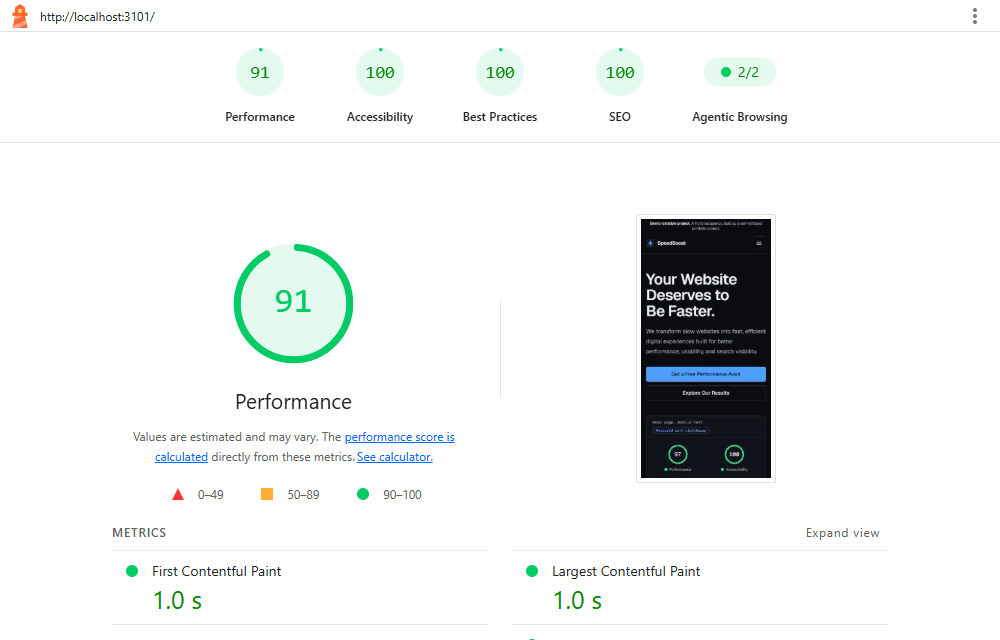
After the third fix, the score reached 100 with almost no blocking time. Restoring self-hosted fonts then lowered it to 93, even though paint times improved. Total Blocking Time only counts tasks after first paint, so the most likely explanation is that the slow fonts delayed first paint past the startup work and hid it. Reading only the score would have led to the wrong conclusion.
The heaviest problem wasn't the most harmful one
Removing the image cut transfer from about 4.5 MB to about 400 KB and brought LCP from 4.0 s to 1.5 s, but the score only rose from 56 to 69. The much smaller hydration work had the larger effect on the score, because it blocked the main thread.
Not every fix moves every metric cleanly
Removing the three libraries saved about 167 KB, yet measured blocking time went up, not down. The hydration work still dominated at that stage, and blocking time varies between runs. Fix-by-fix figures show direction, not a precise value for each fix.
One page's problem can reach other pages
The baseline's other pages also downloaded the home page's 4.1 MB image, though they never display it. Link prefetching of the home route is the most likely cause. A problem on one page can cost visitors on every page that links to it.
Some ideas should be tested and rejected
Turning off link prefetching saved only about 15 KB and didn't improve the score or blocking time beyond normal variation, while it would make navigation slower. The idea was dropped. Most of the remaining blocking time comes from starting the Next.js and React runtime.